Process & Instrumentation Diagram usually expressed as `P & I Diagram’ is a vital tool for a Plant Designer. The simplicity or complexity of any manufacturing process is understood through a P & I Diagram
The Importance of Process Flow Diagrams (PFDs) in Plant Design
A Process Flow Diagram (PFD) serves as a foundational tool in the field of plant design and engineering. It provides a simplified yet comprehensive visual representation of a manufacturing process. Whether you’re scaling up from laboratory research to industrial production or planning a new facility, the PFD is the first step toward understanding and optimizing the process flow.
Process Flow Diagram vs. Process & Instrumentation Diagram (P&ID)
While often confused, the Process Flow Diagram (PFD) and the Process & Instrumentation Diagram (P&ID) serve distinct purposes. The PFD is a high-level, block diagram that illustrates the flow of materials and utilities throughout a process. It lays out the sequence of operations, highlighting key steps such as chemical reactions, separations, and heat exchange.
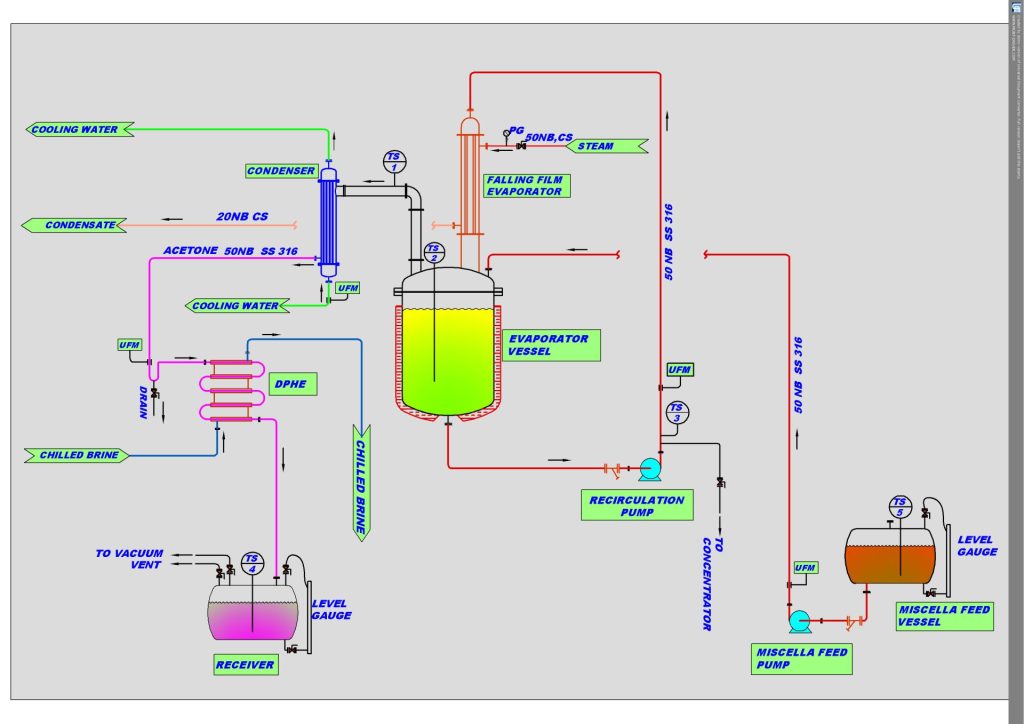
The P&ID, on the other hand, builds on the PFD by introducing a greater level of detail. It incorporates process equipment like reactors, filters, and condensers, as well as instruments (e.g., temperature sensors, pressure gauges, and pH meters), pipelines, and control systems. Together, the PFD and P&ID provide a complete picture of the plant’s operation.
The Role of a Process Flow Diagram in Technology Transfer
When transferring manufacturing technology from the lab to industrial production, the Process Flow Diagram plays a critical role. It acts as a bridge between research and implementation, allowing process engineers to capture and document vital knowledge from technologists. This visual tool helps communicate process requirements clearly to designers, consultants, and clients, fostering collaboration and ensuring alignment.
Key Elements of a Process Flow Diagram
A well-designed PFD includes the following components:
- Process Blocks: High-level representations of key equipment or stages.
- Flow Paths: Arrows indicating the direction of material or utility flow.
- Key Data: Details such as operating conditions, temperatures, and pressures.
These elements make the PFD a vital communication tool for all stakeholders involved in the project.
From Process Flow Diagram to P&ID
The transition from a Process Flow Diagram to a Process & Instrumentation Diagram involves adding layers of complexity and detail. The P&ID specifies:
- Equipment: Reactors, dryers, columns, pumps, and more.
- Instrumentation: Devices to measure and control parameters like pressure, temperature, and pH.
- Pipeline Details: Information about size, material of construction, and joint types.
- Valves and Fittings: Tags and specifications for different types of valves (e.g., ball, gate, butterfly).
Why the Process Flow Diagram is Essential
A Process Flow Diagram not only simplifies complex processes but also serves as a foundation for the P&ID. It ensures that all ideas—whether from the technologist, client, or consultant—are documented and easily understood. Furthermore, the detailed P&ID that evolves from the PFD becomes a crucial resource for preparing Bills of Materials (BOM) or Bills of Quantities (BOQ), aiding in cost estimation and investment planning.
In conclusion, the Process Flow Diagram (PFD) is an indispensable tool for process engineers and plant designers. By providing a clear and concise visual representation of process flows, it lays the groundwork for efficient and effective plant design.