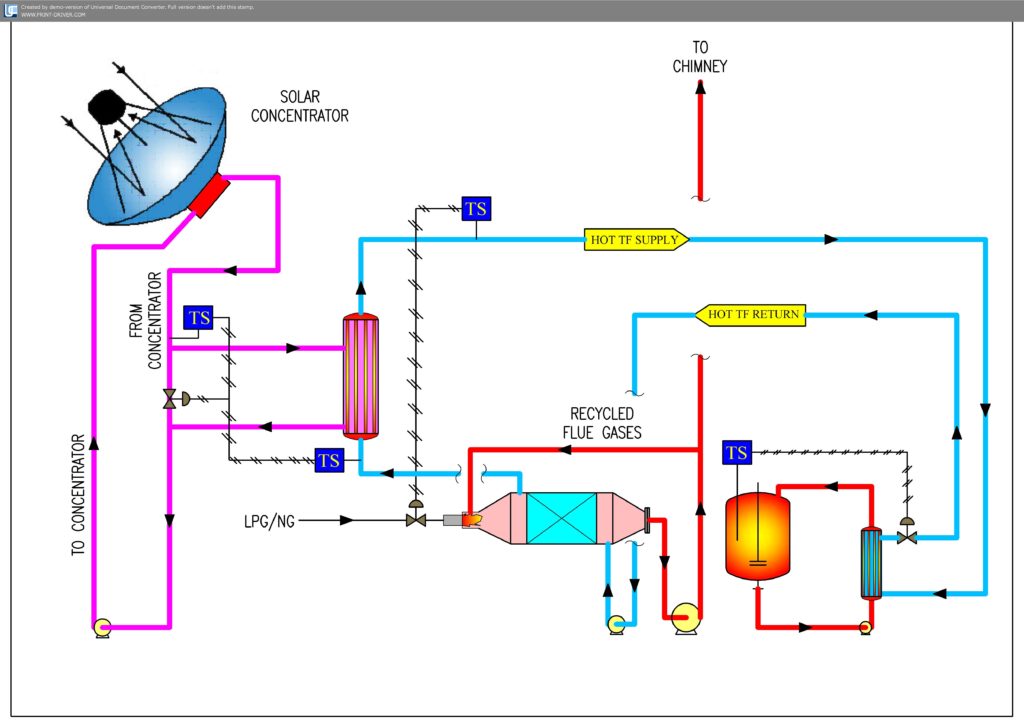
Process and Instrumentation – P and I diagram to reduce drying cost
Design of any manufacturing facility should ideally start with preparation of a Process & Instrumentation Diagram (P & I diagram) for the process and utilities.
P and I diagram is a must for any designer to begin with.
Below are a few samples of P & I Diagrams :

Process & Instrumentation Diagram usually expressed as `P & I Diagram’ is a vital tool for a Plant Designer. The simplicity or complexity of any manufacturing process is understood through a P and I Diagram.
P and I diagram helps in crystallization of all thoughts and concepts to be put down pictorially. This helps identifying the optimum number of accessories viz. accessories like valves, fittings and instruments. This also helps identify areas where uncertainties exist. Sizes of various pipelines and accessories in the pipelines are determined easily when planned through a P and I diagram.
P & I Diagram is a platform which helps all ideas, be it from the technologist, the client or the consultant, to be put on paper for better understanding of the process. The precursor to a P and I Diagram is the PFD or the Process Flow Diagram which essentially is a Block Diagram describing pictorially the process flow.
Equipment interlocks also get depicted through P & I diagrams. Chemical Process Engineers follows the concept of putting down the flowrate and values of targeted process parameters viz. temperature and pressure displayed in the P and I diagram.
The P & I Diagram, once complete, becomes the basis for preparing the Bill Of Quantities ( BQ ) or the Bill Of Material (BOM) which then paves the way for estimating the investment.
Want to know more? Here are the different methods of optimization of chemical processes in chemical process engineering which is very helpful for the regular process